Written by Carl R.
Introduction
Financial analysis based on a comparison of the company's financial statements is critical in making investment decisions and evaluating the company's performance. Depending on the purpose of such an analysis, there are many financial instruments for assessing the financial position of a company. One of the most common financial instruments that not only allows users to assess the company's performance, but also provides an opportunity to compare with industry averages, is ratio analysis (Baker and English, 2011).
The main purpose of this report is to compare financial performance of two British pharmaceutical companies: GlaxoSmithKline plc (GSK) and AstraZeneca plc (AZ) by analysing different financial ratios of both firms for the period of 5 years from 2012 to 2016. This report compares the financial performance of these companies using five categories of financial ratios: Profitability ratios; Liquidity ratios; Efficiency ratios; Long-term solvency (Gearing) ratios and Investment ratios.
The full list of ratios, formulas and calculations are given in Appendices A-C at the end of this report. The main source of information for the analysis is the annual reports of GlaxoSmithKline and AstraZeneca for the periods 2012-2016, which are available from their websites. Financial statements of GlaxoSmithKline are presented in GBP, while financial statements of AstraZeneca - in USD. However, differences in presentation currencies do not affect the results of analysis as they are based on financial ratios. Information on share prices was retrieved from the London Stock Exchange (2017a; 2017b).
Profitability Analysis
Figure 1 and 2 show that GSK had higher returns on assets (ROA) and return on equity (ROE) over the last five years mostly owing to its higher net income. This is due to GSK’s product portfolio, which includes some essential medicines with a high level of demand.

On the other hand, the higher ROE of GSK can be owed to the lower size of capital since the company spent a significant part of the retained earnings on corporate transactions such acquisitions and distribution to shareholders.

In 2012, the profitability of assets for both companies was at the level of 12%, while in the next periods GSK’s management was able to improve the use of assets to generate income. Nevertheless, volatility in income led to significant fluctuations in ROA. With a peak of 16% in 2015, in 2016 it collapsed to 2% (Figure 1). A similar dramatic fall is observed in ROE, which fell from 94% in 2015 to 20% in 2016 (Figure 2). The reason for this decline is the company's internal restructuring, which adversely affected the net profit.
On the other hand, the profitability of AZ is on the rise. Since 2014, it has shown a positive trend both in ROA and ROE growth (Figure 1 and 2). The increase in profitability is due to the AZ's low debt level and better operational productivity, which allows the company to use its assets more efficiently. However, it is difficult to predict whether this trend will continue in the future or whether GSK would regain leadership.
A profit margin measures the internal profitability of companies by evaluating the ability of income generation from dollar or pound of sales. Figure 3 shows that gross margin of both companies did not change significantly. An average gross margin was 67% and 80% for GSK and AZ, respectively. The higher AZ’s gross margin indicates that the company has better productivity and control over the cost of sales.

From Figure 4, AZ still demonstrates growth in its profitability compared to GSK. The net profit margin gradually increased in 2014-2016 from 4.65% to 14.81% after a period of decline. It is noteworthy that efficient cost management and good marketing strategies for AZ’s products explain this growth in profit margins.
The net profit margin of GSK decreased from 18% in 2012 to 3.81% in 2016 despite the fact that in 2015 the company managed to achieve a 35% margin due to income on disposal of businesses and assets in amount of £9.661 bln. Having cleared the indicator from these incomes, there is a downward trend in the net profit margin of GSK.

At the same time, AZ is performing quite well in 2014-2016, especially in the net margin. GSK’s performance is subject to the negative influence of factors such as on-going internal restructuring and asset revaluation.
Liquidity Analysis
The Current ratio shows the adequacy of the company's current assets to meet its current obligations. From Figure 5 and 6 below it is evident that despite good historical performance for the last 5 years none of the companies was able to achieve a current ratio of one in 2016, which is often suggested as a necessary minimum for stable operations (Beyer, 2010).

Both companies showed similar performance with GSK’s current ratio of 0.88 and AZ’s of 0.87. Since company management is not able to meet current liabilities with existing current assets, GSK and AZ show signs of risk in their activities.

Similar to the Current ratio, the Quick ratio and the Cash ratio show the ability of a company to meet its short-term obligations using cash and marketable securities. Figures above show that GSK performed better than AZ in terms of the quick and cash ratios. This can be explained by the significant cash reserves that GSK needs to pay dividends to its shareholders. However, both companies had a significant decline in all liquidity ratios in 2016.
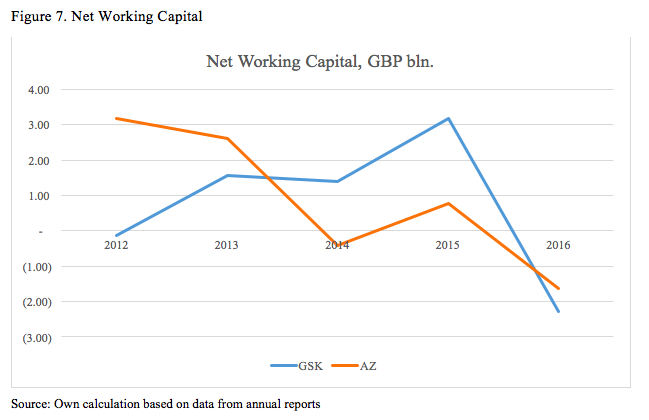
Net working capital also determines if a company has enough current assets to meet its current obligations. The figure above shows that both companies had a working capital deficit: £1.63 billion for AZ and £2.29 billion for GSK. This is a warning sign for a potential problem with liquidity for both companies in future.
Efficiency Analysis
A turnover analysis measures the efficiency of the company’s operations. In this report, Net Asset, Receivables, Inventory and Payables turnovers were used. Higher ratios except payables turnover are desirable as they represent the overall efficiency of the company. A lower payables ratio is preferable as delay payments allow the company to generate income from credit cash (Gibson, 2012).

Figure 8 indicates that both companies have a good efficiency. However, GSK showed higher results for assets and receivables turnover during the 2012-2016 period. GSK has better credit control department, which helps it to efficiently collect outstanding debts, and its management is able to manage resources appropriately. On the other hand, AZ works more effectively with creditors, which allows it to have a longer grace period for credit purchases. Inventory turnover of AZ is also higher, which indicates a good stock management.
Gearing Analysis
Figures 9-11 show results of gearing analysis using the most common metrics. Debt ratio is used to determine the financial risk of the company by calculating the amount of assets required for the redemption of loans (Beyer, 2010). From Figure 9 it is evident that GSK and AZ trend in debt ratio is lower than one. It means that both companies are rather solvent in the long run. Low leverage level decreases the credit risk (Pachamanova and Fabozzi, 2010). Even though AZ started accumulating more debt after 2014, the company is still safer compared to GSK because GSK has a larger amount of loans but the financial leverage has been decreasing, which indicates that it is under control.

Equity ratio determines the share of total assets provided by shareholders and the company's retained earnings (Beyer, 2010).

A low equity ratio is desirable for stockholders, but only if ROA is greater than the cost of debt (Gibson, 2012). This is because gearing can accelerate growth in net income. However, the downside of this is that the cost of financial distress is also high when excessive leverage is used. So, this requires a non-linear interpretation. According to Figure 10, GSK demonstrated higher financial leverage with an average equity ratio of 0.12 compared to AZ’s ratio of 0.35. Debt-Equity ratio (D/E), presented in Figure 11, evaluates the capital structure of a company.

The graph shows that until 2016 AZ was a conservative company, as its D/E was lower than one. GSK is a leveraged firm, which takes advantage of the opportunity to attract borrowed capital.
The interest coverage ratio shows how many times the earnings before interest and taxes (EBIT) exceeds the company's borrowing costs (Gibson, 2012). Figure 12 below shows the interest coverage ratio for the two large pharmaceutical companies significantly decreased.

During the period 2012-2016, GSK showed excellent results: its operating income was sufficient to cover interest expenses. However, the figure shows that both companies had ratio 3.62 and 2.00 for GKS and AZ respectively while the recommended ratio must be more than 1.5 (Gibson, 2012). For the last five years companies were able cover their financial costs. Therefore, there were no insolvency threat for them.
Investment Analysis
During the reviewed period, Earnings per Share (EPS) of AZ were a little higher than GSK’s ratio (Figure 13). However, in 2016, EPS of AZ increased up to 2.26 while for GSK the ratio fell down to 0.19. Higher EPS indicates better profitability and performance of the company (Baker and English, 2011). Therefore, the 2016 figures show the attractiveness of AZ based on the EPS ratio.

The Price/Earnings (P/E) Ratio is used to evaluate under- and over-valuation of shares. A relatively low P/E ratio may indicate disappointing investors and an undervaluation of the company while companies with high P/E ratios are expected to show a high growth rate (Baker and English, 2011). However, such companies could also be overvalued, which is a risk factor for investors.

Figure 14 shows AZ had the largest ratio in 2014, after which investors questioned its further growth. On the other hand, dramatic increase in GSK P/E ratio from 7.88 in 2015 to 83.09 in 2016 indicated that the company, despite temporary decline in its basic ratios, is expected by the market to generate higher earnings in future.
The Pay-Out Ratio determines the share of net profit that is distributed among the shareholders. This ratio could indicate changes in dividend policy since the company needs to keep balance between distributed profits and the profit retained for the future investments and operations (Baker and English, 2011).

Figure 15 shows that GSK had a higher pay-out ratio in 2016 in order to support declining share price, while during the 2012-2015 period it retained more earnings than AZ for internal operations. The Dividend Yield Ratio shows the ratio of the dividends per share and share price.

A higher yield attracts more investors according to the “bird in the hand” theory because it brings them more certain income compared to capital gains. Both companies showed a solid yield of 5-6% during the reported periods. However, GSK performed better than AZ due to its generous dividend policy.
Conclusion
The analysis of financial performance of GlaxoSmithKline plc and AstraZeneca plc showed that both companies have a strong financial position. One cannot say that one company performs better than the other because each of them has its own competitive advantages in different areas. However, according to the ratio analysis, GSK is experiencing a temporary decline in financial performance due to internal restructuring. Therefore, investing funds in GSK now could be risky. On the other hand, investment analysis shows that the market predicts the future growth of the company based on current multiples. Risk-seeking investors could be advised to buy shares of GSK for future capital gains. Likewise, GSK shares are attractive to individuals who require a high yield. As for the AZ shares, the market does not expect abnormal future growth. Therefore, investors could be advised to hold their shares if they have already invested and wait before opening new long positions.
References
Accountingverse (2017) Financial Ratio Analysis, [Online] Available at: http://www.accountingverse.com/managerial-accounting/fs-analysis/financial-ratios.html, [Accessed: January 12, 2018].
AstraZeneca (2017) Annual Report 2016, [Online] Available at: https://www.astrazeneca.com/content/dam/az/Investor_Relations/Annual-report-2016/AZ_AR2016_Full_Report.pdf, [Accessed: January 12, 2018].
AstraZeneca (2015) Annual Report 2014, [Online] Available at: https://www.astrazeneca.com/content/dam/az/Investor_Relations/annual-reports-homepage/2014-Annual-report-English.pdf, [Accessed: January 12, 2018].
AstraZeneca (2013) Annual Report 2012, [Online] Available at: https://www.astrazeneca.com/content/dam/az/Investor_Relations/annual-reports-homepage/2012-Annual-report-English.pdf, [Accessed: January 12, 2018].
Baker, H. K. and English, P. (2011) Capital budgeting valuation: Financial analysis for today's investment projects. Hoboken, N.J: Wiley.
Beyer, S. (2010) International Corporate Finance - Impact of financial ratios on long term credit ratings: Using the automotive examples of BMW Group, Daimler Group and Ford Motor Company. München: GRIN Verlag GmbH.
Gibson, C. H. (2012) Financial Reporting and Analysis. Ontario: South-Western Pub.
GlaxoSmithKline (2017) Annual Report 2016, [Online] Available at: http://www.gsk.com/media/3609/annual-report-2016.pdf, [Accessed: January 12, 2018].
GlaxoSmithKline (2015) Annual Report 2014, [Online] Available at: http://www.gsk.com/media/2711/annual-report-2014.pdf, [Accessed: January 12, 2018].
GlaxoSmithKline (2013) Annual Report 2012, [Online] Available at: http://www.gsk.com/media/2694/annual-report-2012.pdf, [Accessed: January 12, 2018].
London Stock Exchange (2017a) GlaxoSmithKline Company Information, [Online] Available at: http://www.londonstockexchange.com/exchange/prices-and-markets/stocks/summary/company-summary/GB0009252882GBGBXSET1.html, [Accessed: January 12, 2018].
London Stock Exchange (2017b) AstraZeneca Company Information, [Online] Available at: http://www.londonstockexchange.com/exchange/prices-and-markets/stocks/summary/company-summary/GB0009895292GBGBXSET1.html, [Accessed: January 12, 2018].
Pachamanova, D. A. and Fabozzi, F. J. (2010) Simulation and optimization in finance: Modelling with MATLAB, @Risk, or VBA. Hoboken, N.J: Wiley.
Appendix A
Formulas
| Ratio | Formula |
| Profitability | |
| Return on Assets | Net Profit/Total Assets |
| Return on Equity | Net Profit/Total Equity |
| Net Margin | Net Profit/Total Sales |
| Gross Margin | Gross Profit/Total Sales |
| Liquidity | |
| The Current Ratio | Current Assets/Current Liabilities |
| Quick Ratio | (Current Assets-Inventory)/Current liabilities |
| Cash Ratio | Cash/Current Liabilities |
| Net Working Capital | Current Assets - Current Liabilities |
| Efficiency | |
| Total Assets Turnover | Sales/Average Total Assets |
| Receivables Turnover | Credit sales/Average Receivables |
| Inventory Turnover | Cost of sales/Average Inventories |
| Payables Turnover | Credit Purchases/Average Payables |
| Gearing | |
| Debt Ratio | Total Debt/Total Assets |
| Equity Ratio | Total Equity/Total Assets |
| Debt-Equity Ratio | Total Debt/Total Equity |
| Interest cover | EBIT/Interest |
| Investment | |
| Earnings per Share Ratio (EPS) | (Net Income-Preferred dividends)/Weighted average number of shares |
| Price/Earnings Ratio (P/E) | Market price/EPS |
| Pay-Out Ratio | Dividends per share/EPS |
| Dividend-Yield Ratio | Dividends per share/Market price |
Source: Accountingverse (2017)
Appendix B
Ratios
| GlaxoSmithKline (GDP) | 2012 | 2013 | 2014 | 2015 | 2016 |
| Profitability | |||||
| Return on Assets | 11.44% | 13.37% | 6.96% | 15.66% | 1.80% |
| Return on Equity | 70.31% | 72.04% | 57.35% | 94.30% | 21.40% |
| Net Margin | 17.95% | 21.23% | 12.31% | 35.00% | 3.81% |
| Gross Margin | 70.13% | 67.61% | 68.17% | 62.99% | 66.69% |
| Liquidity | |||||
| The Current Ratio | 0.99 | 1.11 | 1.10 | 1.24 | 0.88 |
| Quick Ratio | 0.70 | 0.83 | 0.79 | 0.88 | 0.61 |
| Cash Ratio | 0.30 | 0.40 | 0.33 | 0.43 | 0.26 |
| Net Working Capital | -123 | 1,550 | 1,383 | 3,170 | -2,290 |
| Efficiency | |||||
| Total Assets Turnover | 0.64 | 0.63 | 0.56 | 0.51 | 0.50 |
| Receivables Turnover | 4.89 | 4.96 | 4.58 | 4.68 | 4.79 |
| Inventory Turnover | 2.01 | 2.18 | 1.80 | 1.98 | 1.89 |
| Payables Turnover | 1.02 | 1.05 | 0.90 | 1.11 | 1.08 |
| Gearing | |||||
| Debt Ratio | 0.44 | 0.43 | 0.46 | 0.31 | 0.32 |
| Equity Ratio | 0.16 | 0.19 | 0.12 | 0.17 | 0.08 |
| Debt-Equity Ratio | 2.71 | 2.34 | 3.81 | 1.87 | 3.79 |
| Interest cover | 9.28 | 9.67 | 5.08 | 14.90 | 3.62 |
| Investment | |||||
| Earnings per Share Ratio (EPS) | 0.93 | 1.13 | 0.57 | 1.74 | 0.19 |
| Price/Earnings Ratio (P/E) | 14.37 | 14.32 | 24.01 | 7.88 | 83.09 |
| Pay-Out Ratio | 0.84 | 0.68 | 1.39 | 0.46 | 5.31 |
| Dividend-Yield Ratio | 5.82% | 4.73% | 5.81% | 5.84% | 6.39% |
| AstraZeneca (USD) | 2012 | 2013 | 2014 | 2015 | 2016 |
| Profitability | |||||
| Return on Assets | 11.82% | 4.60% | 2.11% | 4.71% | 5.45% |
| Return on Equity | 0.264153 | 0.110566 | 0.062863 | 0.152682 | 0.204331 |
| Net Margin | 22.62% | 10.00% | 4.65% | 11.44% | 14.81% |
| Gross Margin | 80.72% | 79.54% | 77.99% | 81.20% | 82.06% |
| Liquidity | |||||
| The Current Ratio | 1.37 | 1.27 | 0.96 | 1.08 | 0.87 |
| Quick Ratio | 1.22 | 1.15 | 0.85 | 0.93 | 0.72 |
| Cash Ratio | 0.55 | 0.57 | 0.37 | 0.42 | 0.33 |
| Net Working Capital | 5,145 | 4,284 | -633 | 1,138 | -1,994 |
| Efficiency | |||||
| Total Assets Turnover | 0.53 | 0.47 | 0.46 | 0.42 | 0.38 |
| Receivables Turnover | 3.41 | 3.32 | 3.51 | 3.57 | 4.11 |
| Inventory Turnover | 2.76 | 2.65 | 3.02 | 2.26 | 1.84 |
| Payables Turnover | 0.59 | 0.54 | 0.56 | 0.42 | 0.35 |
| Gearing | |||||
| Debt Ratio | 0.19 | 0.19 | 0.19 | 0.25 | 0.27 |
| Equity Ratio | 0.45 | 0.42 | 0.34 | 0.31 | 0.27 |
| Debt-Equity Ratio | 0.43 | 0.45 | 0.55 | 0.81 | 1.01 |
| Interest cover | 9.06 | 7.60 | 2.29 | 3.85 | 2.00 |
| Investment | |||||
| Earnings per Share Ratio (EPS) | 4.99 | 2.04 | 0.98 | 2.23 | 2.77 |
| Price/Earnings Ratio (P/E) | 9.45 | 28.91 | 72.52 | 30.64 | 19.70 |
| Pay-Out Ratio | 0.58 | 1.37 | 2.86 | 1.25 | 1.01 |
| Dividend-Yield Ratio | 6.09% | 4.74% | 3.94% | 4.10% | 5.13% |
Appendix C
Extracts from Annual Reports
AstraZeneca (2016):


AstraZeneca (2014):


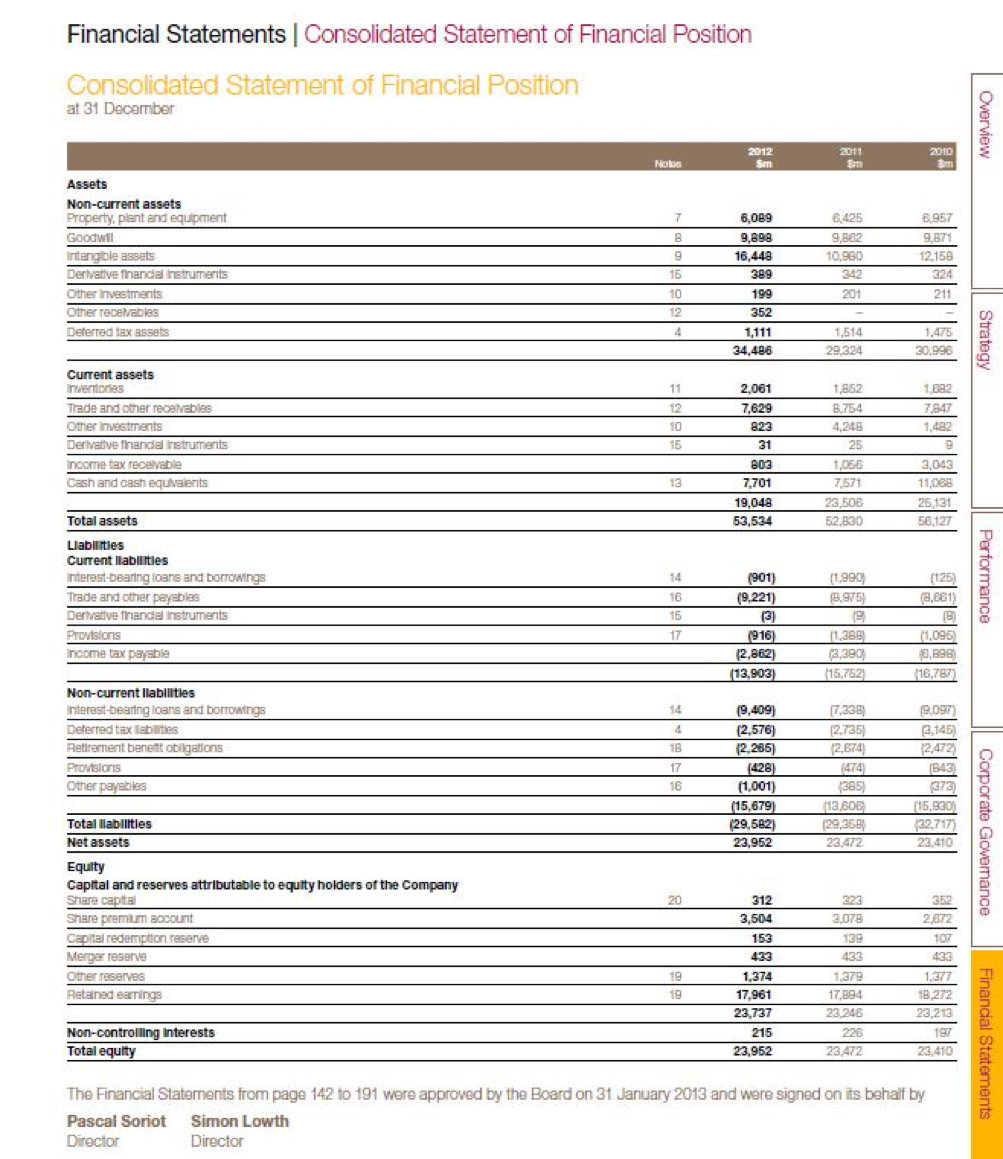
AstraZeneca (2012):

GlaxoSmithKline (2016):


GlaxoSmithKline (2014):


GlaxoSmithKline (2012):


")