1. Introduction
The relationship between inflation and economic growth (GDP) remains a controversial topic in modern research. On the one hand, traditional views voiced by such authors as Bernanke et al. (2018) claim that these two factors are negatively correlated with each other. The relationship between gdp and inflation scholarly is seen as a decreasing spending and purchase capacity of customers in the case of high inflation rates. Hence, lower figures for this element allow buyers to spend more and boost economic growth in the form of consumption, net exports, investments, and government expenditures. On the other hand, some scholars including Ageli (2022) suggest a more complex relationship where such an increase may actually create rising inflation. This premise is largely based on the fact that greater production of goods and services increases the supply in the market and decreases their price if the demand rates remain the same. This causes decreased production and slows down the growth rates of the economy as well as the velocity of money, which leads to inflation (Kyo, 2018). This essay seeks to explore the available empirical evidence in this sphere to identify whether this unconventional view is supported by real facts uncovered by past studies and statistical data.
2. Inflation and Economic Growth
Inflation is usually defined as the difference between two measurement results representing a change in the prices of products and services over the analysed period between these two dates (Mobius, 2020). If the second figure is lower than the first one, this means that consumers with a fixed purchasing capacity will not be able to purchase the same amount of goods in the future. Since measuring all prices for all products and services is both challenging and unnecessary due to different growth rates, most countries use some form of a consumer price index (CPI). It reflects an approximation of inflation rates for the most popular and relevant products and services. The benefits of low and stable figures in this dimension allow labour markets to promptly react to economic recessions and stabilise the economy by granting every decision-maker a predictable picture of the future (Barbosa, 2018). On the contrary, high or rapidly changing inflation rates reduce the opportunity costs of saving money and force sellers to raise prices due to the perceived need to purchase new raw materials and supplies at an increased cost. This may create a self-fulfilling prophecy effect as this momentum develops across distributed value networks. However, some experts state that medium-to-high inflation rates stimulate spending as population members see no direct advantages in money-hoarding due to money depreciation (Kamaiah et al., 2018). This may stimulate the economy and support local manufacturers and retailers.
Economic growth is usually defined as the difference between two measurements of the real gross domestic product (GDP) (Sabillon, 2019). It serves as a convenient indicator of national well-being and is usually adjusted for inflation. GDP reflects the quantities of all products and services produced in a certain country multiplied by their market sales rates. Economic growth is widely applied to appraise improvements in labour productivity and other factors ensuring the increasing per capita figures. There also exist various alternative approaches to GDP calculation such as the measurement of all generated income, all spending or all value added by producers (Thomas, 2021). With that being said, multiple experts state that there exist optimal economic growth rates ensuring minimal inflation and unemployment rates that must not be exceeded (Mishra et al., 2021). The violation of this rule speeds up the aggregate demand for products and services beyond the capability of suppliers, which may lead to hyperinflation in the case when no countermeasures are introduced.
3. Country-Level Data
The data presented in the following figures was taken from the World Bank database (World Bank, 2023a; World Bank, 2023b). As seen on the graphs, inflation trends demonstrated a large number of changes within the three analysed decades. The largest spikes were seen in 1994 and 2008 where rates grew by 3-5% on average. At the same time, there were no major changes in 2020 when the whole world was hit by a global pandemic.
Figure 1: World Bank’s Global Inflation Rates (%)
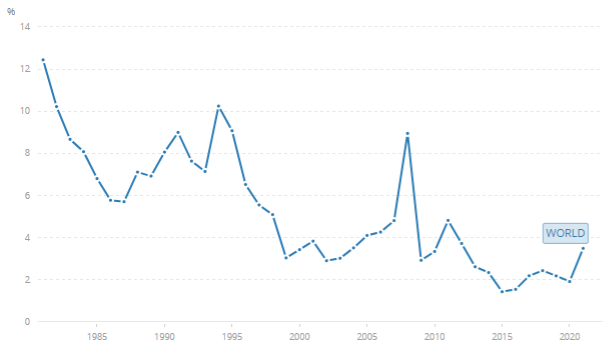
Source: World Bank (2023a, n.p.)
On the contrary, the World Bank (2023b) data for GDP does not demonstrate similar major changes throughout the same period. While these figures demonstrated minor declining trends in 2008 and 2020, they could be explained by the global financial crisis and the COVID-19 pandemic having a devastating effect on global economies (Ghecham, 2022).
Figure 2: World Bank’s Global GDP Growth (Trillion USD)
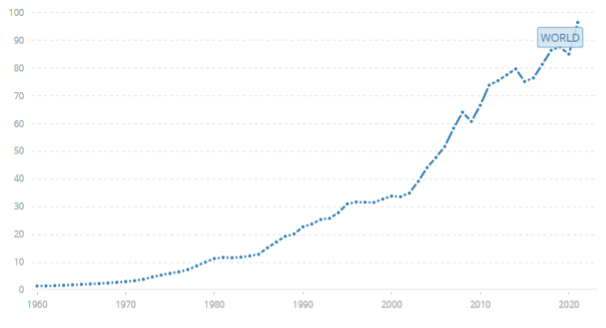
Source: World Bank (2023b, n.p.)
Overall, the approximated data from multiple analysed states does not demonstrate strong relationships between the two graphs. However, Thomas (2021) noted that such correlations may occur at national rather than global levels. Hence, another comparison of data has been performed using Statista (2023a) data for the UK. As seen in the graph below, the country’s inflation rates have been changing on an annual basis. However, these fluctuations rarely exceeded 1-2% since this country is characterised by a strong and stable economy.
Figure 3: UK Inflation Rates (%)
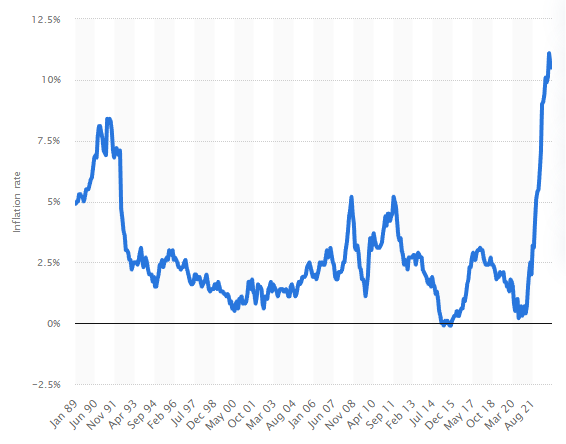
Source: Statista (2023a, n.p.)
GDP rates shown in the figure below demonstrate minor fluctuations with most of them not being directly linked with the trends in the previous figure (Statista (2023b). For example, the dips in inflation rates occurring in 2014-2015 were not present on the second graph. Effectively, only the 2008 and 2020 trends were showing some degree of similarity as they were related to a global financial crisis and a global pandemic substantially affecting the country's economy.
Figure 4: UK GDP (Million GBP)
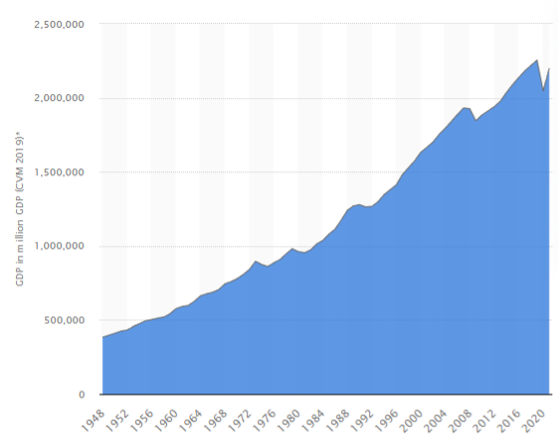
Source: Statista (2023b, n.p.)
The analysis of statistical data in this section has not provided a univocal interpretation of the relationships between inflation and economic growth (GDP). The following section explores the empirical evidence on the topic to further explore possible correlations between these two variables.
4. Empirical Evidence
The study by Sumon and Miyan (2017) explored the 30-year period of Bangladesh's history to identify whether inflation was linked with economic growth in this country. Their findings based on the Johansen co-integration test and the two-step Engle-Granger test indicated a significant positive relationship between these two variables. However, these correlations were primarily visible in the long-term perspective such as approximated figures based on five-year periods. It should also be noted that the analysed country had two-digit inflation rates multiple times throughout the analysed decades, which characterises its economy as a relatively unstable one. Another piece of evidence about developing states was provided by Ahmad (2022) who investigated the relationship between inflation and economic growth in Pakistan. According to their findings, the first variable had an adverse long-term effect on the second one if its prominence reached two-digit values. However, moderate levels of stable inflation boosted trade and facilitated economic growth due to the positive effects on the agriculture sectors and other industries.
Secondary evidence from Vietnam provided by Tien (2021) suggested that inflation adjustment was a crucial part of many governments seeking to achieve long-term GDP growth and economic stability. The aforementioned adverse effects of high values of this indicator suggested a ‘threshold value’ that amounted to 6% in the case of this country. Higher rates had a detrimental effect on economic growth while lower ones facilitated it due to their stimulating effect on the national economy. These findings were in line with the general agreement that hyperinflation had to be prevented at all costs in order to avoid financial crises in both developing and developed states. Similar results were obtained by Kusumatrisna et al. (2022) who investigated Indonesian data collected between 1994 and 2019. As found by these researchers, inflation had a highly negative effect on GDP growth after crossing the threshold value of 9.59 per cent. These differences between the two analysed countries may indicate that the state of the national economy may determine its tolerance for high rates of the first variable. These assumptions were partially confirmed by the researchers finding differences in threshold values between eastern and western regions of Indonesia that amounted to 3.89%.
As also found by Mandeya and Ho (2021) in their analysis of the South African context, the analysed variable adversely affected economic growth in both short- and long-term perspectives. This correlation was primarily explained by the ‘inflation uncertainty’ factor where the lack of stability convinced multiple market players to raise prices creating the aforementioned ‘snowball effect’ that was not necessarily based on real problems. As a result, optimal values of this indicator had to be stable in the long-term perspective rather than low in the short-term perspective, which was frequently overlooked by government policymakers. In the Sri Lankan context, Atigala et al. (2022) used the Auto Regressive Distributed Lag framework to estimate the impact of inflation on economic growth. According to their findings, these two variables were negatively correlated. At a practical level, a 1% increase in inflation decreased GDP figures by $3,427.94 million in the short-term perspective with the adverse long-term effect amounting to $107,263.8 million. These considerations further implied that national rates had to be closely monitored with appropriate micro- and macro-economic policies being promptly introduced to prevent these negative outcomes.
Similar findings were reported by Tenzin (2019) who analysed the associations between inflation and economic growth in Bhutan. According to their results, policymakers had to closely monitor and control the first variable to minimise its uncertainty. The inability to do so led to a reduction in investment intentions and other money-hoarding activities creating higher unemployment rates and other adverse effects slowing down economic growth. The analysis by Dinh (2020) conducted in Vietnam confirmed many of these assumptions by indicating delayed adverse consequences of inflation growth. Similar to Atigala et al. (2022) and Sumon and Miyan (2017), this author discovered that negative effects could be delayed and should be studied over a period of several years. Hence, the absence of economic growth issues in the short-term perspective did not mean that inflation spikes had no impact on it. These delayed problems could substantially hinder the realisation of state preventive policies due to regulatory myopia and limited understanding of decision-makers.
Finally, the studies by Kyo (2018) and Ageli (2022) provided secondary evidence from the context of developed and strong economies. The first project explored Japan using a Bayesian regression model to appraise the relationship between inflation and GDP. As found by the researchers, inflation had a generally negative effect on economic growth in both short- and long-term perspectives. However, lower levels of this variable could be tolerable during periods of expansion due to their stimulating effect on local businesses. Similarly, Ageli (2022) ran Granger causality tests and Vector Error Correction Model tests on UK data collected between 1990 and 2020. According to their findings, the two studied variables were negatively correlated with inflation adversely influencing economic growth rates. Considering the effects of these elements on unemployment rates, a worst-case scenario created substantial long-term problems with GDP increase and national development plans realisation.
5. Conclusion
The analysis of empirical evidence suggests that inflation and economic growth are negatively correlated with the first factor adversely affecting the second one in both short-term and long-term perspectives (Dinh, 2020). These effects were recognised in multiple developed and developing countries, which implies that they have universal nature. As a result, inflation rates have to be closely monitored and controlled by local governments to prevent money-hoarding intentions and reduced investment intentions. The calculations of Atigala et al. (2022) suggest that adverse long-term consequences of such problems can exceed short-term ones manifold. Moreover, such negative outcomes can be delayed according to Dinh (2020) and Sumon and Miyan (2017), which makes it difficult for decision-makers to draw correlations between them in some cases. The analysed evidence from the World Bank (2023a) and Statista (2023a) demonstrates this complexity where the two studied variables did not demonstrate immediate relationships in the short-term perspective. As found by Sumon and Miyan (2017) in their analysis of 30-year data, these correlations can become visible during five-year periods. This introduces additional layers of complexity for policymakers as some practitioners may be unaware of these patterns or may choose to ignore short-term consequences and transfer them to their successors to avoid the use of harsh regulatory measures and substantial criticisms from the general public afterwards.
References
Ageli, M. (2022) “Asymmetric Link between Unemployment, Inflation and GDP growth rate in the United Kingdom Economy: An ARDL Bounds Approach”, Systematic Reviews and Bibliometric-Analyses in Applied Economics Literature, 40 (2), pp. 1-17.
Ahmad, T. (2022) “A Case of Pakistan Investigating the Relationship between Inflation and Economic Growth: A Case of Pakistan”, Acta Pedagogia Asiana, 1 (1), pp. 1-8.
Atigala, P., Maduwanthi, T., Gunathilake, V., Sathsarani, S. and Jayathilaka, R. (2022) “Driving the pulse of the economy or the dilution effect: Inflation impacting economic growth”, Plos one, 17 (8), pp. 1-17.
Barbosa, F. (2018) Macroeconomic Theory: Fluctuations, Inflation and Growth in Closed and Open Economies, Berlin: Springer.
Bernanke, B., Laubach, T., Mishkin, F. and Posen, A. (2018) Inflation Targeting: Lessons from the International Experience, Princeton: Princeton University Press.
Dinh, D. (2020) “Impulse Response of Inflation to Economic Growth Dynamics: VAR Model Analysis”, Journal of Asian Finance, Economics and Business, 7 (9), pp. 219-228.
Ghecham, M. (2022) “The Impact of COVID-19 on Economic Growth of Countries: What Role Has Income Inequality in It?”, Economies, 10 (1), pp. 1-13.
Kamaiah, B., Shylajan, C., Seshaiah, V., Aruna, M. and Mukherjee, S. (2018) Current Issues in Economics and Finance, Berlin: Springer.
Kusumatrisna, A., Sugema, I. and Pasaribu, S. (2022) “Threshold Effect in the Relationship Between Inflation Rate and Economic Growth in Indonesia”, Bulletin of Monetary Economics and Banking, 25 (1), pp. 117 – 132.
Kyo, K. (2018) “The Dynamic Relationship between Economic Growth and Inflation in Japan”, Open Journal of Social Sciences, 6 (1), pp. 20-32.
Mandeya, S. and Ho, S. (2021) “Inflation, inflation uncertainty and the economic growth nexus: An impact study of South Africa”, MethodsX, 8 (1), pp. 1-15.
Mishra, A., Arunachalam, V. and Patnaik, D. (2021) Critical Perspectives on Emerging Economies: An International Assessment, Berlin: Springer.
Mobius, M. (2020) The Inflation Myth and the Wonderful World of Deflation, Hoboken: John Wiley & Sons.
Sabillon, C. (2019) Manufacturing, Technology, and Economic Growth, London: Routledge.
Statista (2023a) “Gross domestic product of the United Kingdom from 1948 to 2021(in million GBP)”, [online] Available at: https://www.statista.com/statistics/281744/gdp-of-the-united-kingdom/ [Accessed on 28 January 2023].
Statista (2023b) “Inflation rate for the Consumer Price Index (CPI) in the United Kingdom from January 1989 to December 2022”, [online] Available at: https://www.statista.com/statistics/306648/inflation-rate-consumer-price-index-cpi-united-kingdom-uk/ [Accessed on 28 January 2023].
Sumon, K. and Miyan, M. (2017) “Inflation and economic growth: An empirical evidence of Bangladesh (1986-2016)”, International Journal of Economics and Financial Issues, 7 (5), pp. 454-465.
Tenzin, U. (2019) “The Nexus Among Economic Growth, Inflation and Unemployment in Bhutan”, South Asia Economic Journal, 20 (1), pp. 94-105.
Thomas, A. (2021) Macroeconomics: An Introduction, Cambridge: Cambridge University Press.
Tien, N. (2021) “Relationship between inflation and economic growth in Vietnam”, Turkish Journal of Computer and Mathematics Education (TURCOMAT), 12 (14), pp. 5134-5139.
World Bank (2023a) “Inflation, consumer prices (annual %)”, [online] Available at: https://data.worldbank.org/indicator/FP.CPI.TOTL.ZG [Accessed on 28 January 2023].
World Bank (2023b) “GDP (current US$)”, [online] Available at: https://data.worldbank.org/indicator/NY.GDP.MKTP.CD [Accessed on 28 January 2023].
")